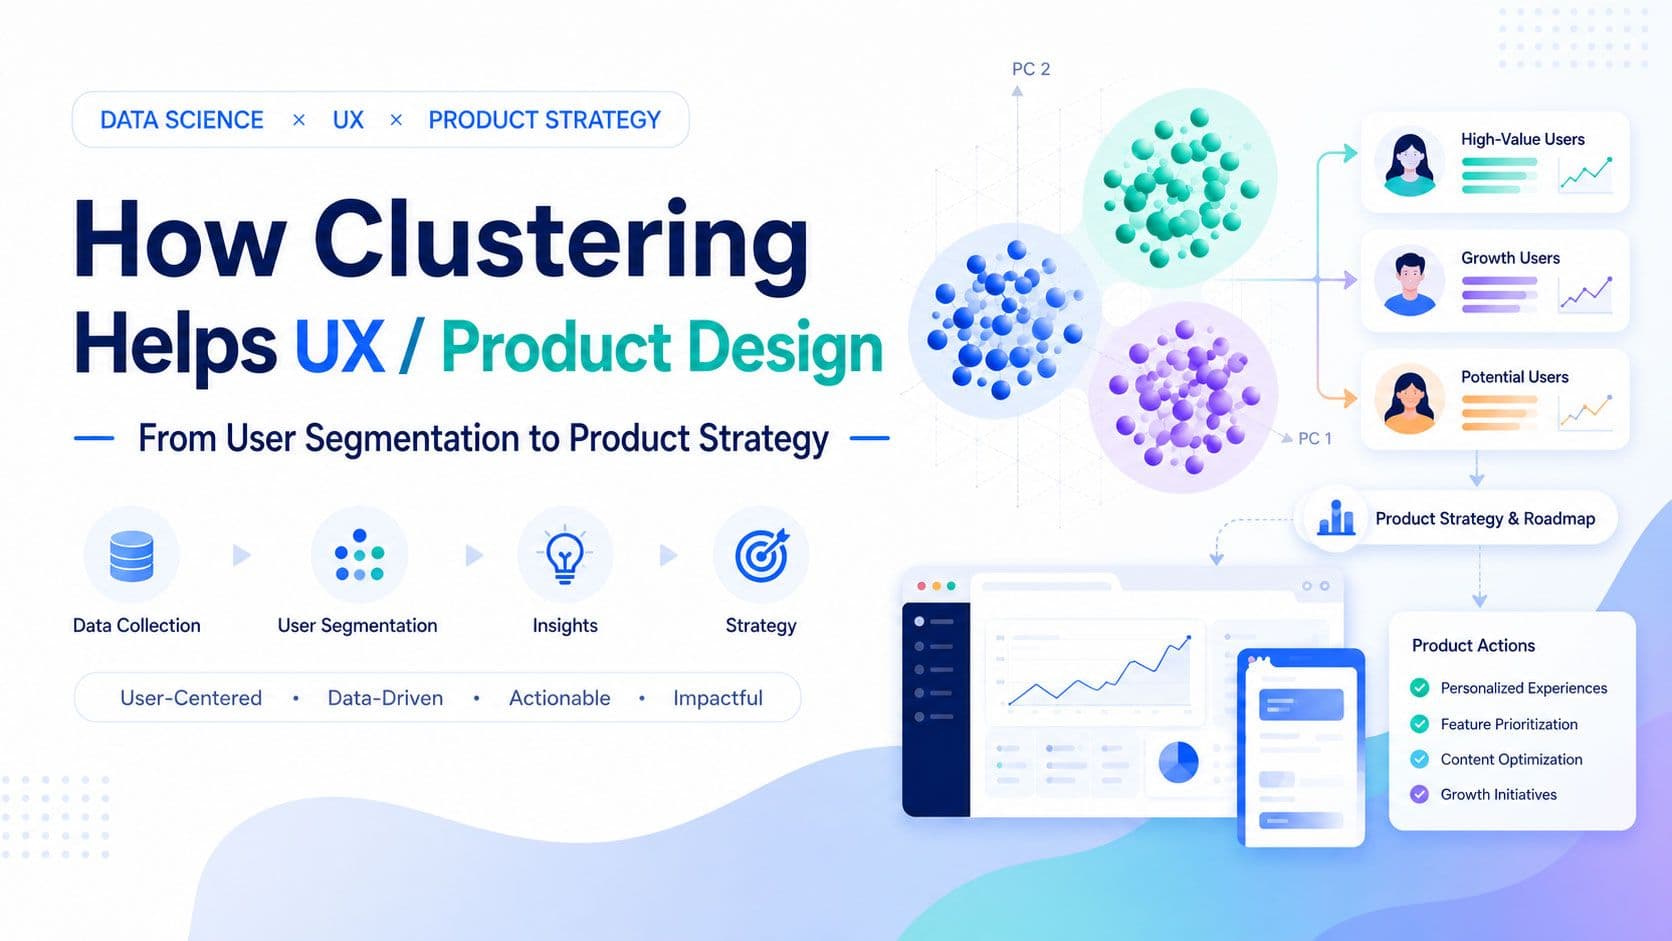
When working on UX / Product Design, we often begin by looking at overall metrics, such as DAU, PV, CTR, session duration, search count, redemption rate, comment rate, and share rate.
These data points are important because they quickly reflect product performance. However, in real product experience analysis, I gradually realized one issue:
Averages can tell us what is happening to the product overall, but they may not explain why different users react differently.
For example, in a lifestyle information or membership app, overall DAU may be slightly increasing, while PV only remains stable. On the surface, the product still has users, and daily active users may even be growing slightly. However, if PV does not increase at the same time, it means that each user’s browsing depth may not be increasing, and may even be declining.
At this point, the boss may feel that product growth is not ideal:
Why has DAU increased, but PV has not?
Is the content not attractive enough?
Is the homepage design not effective enough?
Has traffic quality declined?
Or is user behavior changing?
If the team only looks at overall DAU and PV, it is easy to reach broad conclusions, such as needing more content, bigger banners, more push notifications, or more campaign entry points.
But in reality, the real issue may not be “insufficient traffic.” It may be that the needs and behavioral differences behind different user groups have not been clearly understood.
Some users mainly come to read articles.
Some users only care about offers and rewards.
Some users frequently use search with a clear intent.
Some users browse community content but rarely comment or interact.
Some users were once active but have recently started to slowly drop off.
At this point, we can see that the “average user” is often difficult to apply to real product situations. What we truly need to understand is not a single average value, but the behavioral patterns behind different user groups.
This is where clustering analysis can connect with UX / Product Strategy.
1. What Is Clustering?
Clustering is a common unsupervised learning method. It does not use labeled data to predict an answer. Instead, it finds naturally formed groups from a large amount of unlabeled data based on similarity.
Simply put, clustering groups users with similar behaviors together based on the similarity between data points. In a UX / Product context, clustering can help teams group users with similar usage patterns based on user behavior.
For example, we can use the following behavioral data as the basis for segmentation:
| User Behavior Data | Possible Meaning |
|---|---|
| Article Views | Whether the user enjoys reading content |
| Search Count | Whether the user has clear intent |
| Offer Clicks | Whether the user is attracted by offers |
| Redemption Count | Whether the user has high conversion intent |
| Comment / Like / Share | Whether the user is willing to participate in community interaction |
| Session Frequency | Whether the user has a stable usage habit |
| Last Active Date | Whether the user has churn risk |
In real product analysis, this kind of data is not always perfect at the beginning. Sometimes event tracking is incomplete, and sometimes data definitions across different features are inconsistent. Therefore, before doing clustering, it is usually necessary to organize the event taxonomy and confirm which behaviors truly represent user intent.
2. Why Do UX / Product Teams Need Clustering?
UX design is not only about designing screens. It is also about understanding user behavior, motivation, pain points, and decision paths.
Product Strategy is not only about planning features. It is also about deciding:
- Which users are the most valuable?
- Which users most need experience improvement?
- Which features should be prioritized?
- Which groups have growth potential?
- Which users are starting to churn?
- Which experiences can improve conversion, retention, or engagement?
In real work, Product, Business, Marketing, and UX teams may interpret the same set of data differently. Business may care about conversion. Marketing may care about reach. UX may care about task completion and experience friction.
The value of clustering is that it helps teams move from a “single average” to an understanding of “different user groups and their behaviors.”
In other words, it does not simply answer:
How is overall user performance?
Instead, it helps the team ask further:
What is each type of user doing?
Which type of user deserves priority improvement?
Which type of user needs a different UX / Product Strategy?
3. Case Study Scenario: DAU Slightly Increases, but PV Only Remains Stable
In real product analysis, sometimes the problem does not come from a single metric dropping, but from the gap between several metrics.
For example, the overall DAU of a lifestyle information or membership app is slightly increasing. On the surface, this seems to indicate that the product is still growing because slightly more people are returning to use the product every day.
However, at the same time, PV only remains stable and does not rise together with DAU. This becomes a signal worth paying attention to:
The number of users has increased, but the page views generated by each user have not increased accordingly.
From the perspective of a boss or business stakeholder, this situation may be unsatisfactory. If DAU increases, it should ideally drive more PV, more content exposure, more ad inventory, more offer clicks, or higher engagement. But if PV remains flat, people may question whether the product’s growth is only superficial.
At this point, the question should not stop at:
Why has PV not increased?
It should be further broken down:
Is traffic quality declining? Is the content not attractive enough? Is homepage navigation not effective enough? Is search failing to drive further exploration? Or is the behavior of different user groups changing?
If the team only looks at overall DAU and PV, it is easy to reach a broad conclusion, such as adding more content, enlarging banners, strengthening push notifications, or launching more campaigns.
But these methods may not truly solve the problem, because the real reason may be hidden within the behavioral differences of different user segments.
For example:
| Surface Observation | Possible Hidden Cause |
|---|---|
| DAU slightly increases | New users or low-browsing-depth users increase |
| PV remains flat | High-browsing-depth users decline |
| PV per DAU declines | Average page views per user decrease |
| Search Count increases | Users have clear intent, but do not continue exploring after search |
| Offer Clicks increase | Deal-driven users increase, but content consumption does not increase |
| Returning Users decline | Returning users decrease, and retention starts to weaken |
This is exactly where clustering can create value. It helps the team move from surface-level KPI problems to a deeper breakdown of behavioral patterns across different user groups, uncovering the real reasons why DAU is slightly increasing but PV is not growing accordingly.
4. Using Clustering to Break Down the Gap Between DAU and PV
When the surface data shows that DAU is slightly increasing but PV only remains stable, we can first understand what this phenomenon means:
The number of users has increased, but each user’s browsing depth has not increased, and may even be declining.
At this point, the team should not only look at DAU and PV. Instead, they should further examine the following metrics:
| Metric | Question It Helps Answer |
|---|---|
| PV per DAU | Is average browsing depth per user declining? |
| PV per Session | Is each session becoming shorter? |
| Sessions per User | Has user return frequency changed? |
| New vs Returning Users | Is DAU growth mainly coming from new users? |
| Article Views | Are content-oriented users still active? |
| Offer Clicks | Are deal-driven users increasing? |
| Search Count | Are search-oriented users increasing? |
| Community Views | Is community browsing growing? |
| Last Active Date | Are old users starting to churn? |
These metrics help the team move from “overall performance” to “behavioral changes across different user groups.”
For example, DAU may be slightly increasing because of new users. But if these new users only browse one or two pages and then leave, PV will not increase significantly. Or DAU may be increasing because an offer campaign brings in users, but this group only checks offers, completes redemption, or claims rewards before leaving. Their contribution to article PV or community PV may be limited.
On the other hand, content-oriented users with high browsing depth may be declining. In the past, this group may have read multiple articles, browsed related articles, entered topic pages, or explored tag pages. If their activity declines, even if new users make up for the DAU count, overall PV may only remain flat.
Therefore, DAU slightly increasing while PV remains flat does not necessarily mean the product has no problem, nor does it necessarily mean that the content is unattractive. A more accurate interpretation is:
The product’s user mix may be changing, and different user groups contribute to PV differently.
5. Building Initial Segmentation Hypotheses with Business Logic
Before formally running a data model, the UX / Product Team can first use Business Logic to build an initial hypothesis framework. This helps the team break down the broad question of “Why is PV not increasing?” into several analyzable directions.
For example:
| Initial Hypothetical User Group | Possible Behavior and Impact on DAU / PV |
|---|---|
| New Light Users | New users who only browse one or two pages; DAU may increase, but PV contribution is limited. |
| Content Browsers | Frequently read articles, with high browsing depth; usually important contributors to PV. |
| Deal Hunters | Mainly check offers, rewards, or redemptions; may bring DAU, but page views are not high. |
| Intent Searchers | Have clear intent and leave quickly after search; contribute to DAU, but sessions are shorter. |
| Community Lurkers | Browse community content but rarely interact; generate views, but may not convert into engagement. |
| Churn-risk Users | Activity declines and return visits decrease; may drag down overall PV and retention. |
This step is not meant to directly define the final segmentation. Instead, it helps the team ask more specific questions:
- Is DAU growth mainly coming from new users or returning users?
- Are new users part of a low-browsing-depth group?
- Are Deal Hunters increasing but not driving content browsing?
- Are Intent Searchers increasing but not exploring further after search?
- Are Content Browsers decreasing, causing overall PV to lose its main support?
- Are Churn-risk Users increasing, causing returning users’ browsing depth to decline?
In this way, the team does not stop at the surface problem of “PV is not increasing.” Instead, they can begin to identify which user group changes are causing the gap between DAU and PV.
The value of this step is that it helps the team first establish a direction for analysis. For example, when the team sees that DAU is slightly increasing but PV only remains stable, they can start asking: Are new users mainly coming from New Light Users or Deal Hunters? Are Content Browsers with previously high browsing depth declining? Are search-oriented users increasing but not leading to further content exploration?
However, this kind of initial classification based on business intuition, namely Business Logic Clustering, is only used as a simple reference in this article. It belongs to the first step of segmentation thinking.
The real process of deciding the K value in K-means should begin by using business classification to define a general direction, and then using data-driven methods to identify reasonable candidate values. For example, the Elbow Method and Silhouette Score can be used to evaluate clustering clarity and stability under different K values.
After that, further judgment is still needed from a UX / Business perspective: Can each cluster be clearly named? Does each cluster have enough users? Can each cluster be connected to specific product strategies? Therefore, the final K value should not depend only on the highest mathematical score. Instead, it should strike a balance between data validity, business interpretability, and design actionability.
How to actually determine the K value can be explained in more detail in two separate articles:
How to Define the Number and Types of Clustering (1): Building Segmentation Hypotheses with Business Logic
This article can focus on how to build initial segmentation hypotheses from product goals, user behavior, business scenarios, and UX problems.
How to Define the Number and Types of Clustering (2): Using Data Methods to Find a Reasonable Number of Clusters
This article can focus on how to use methods such as the Elbow Method and Silhouette Score to identify reasonable K-value candidates, and then combine them with UX / Business judgment to make the final decision.
6. Finding the Real Problem from Clustering Results
After the initial hypotheses are established, clustering can be used to group users by behavioral patterns and compare each group’s DAU, PV, PV per User, Session Frequency, Retention, and Conversion.
Through this analysis, the team can see that DAU slightly increasing while PV remains stable may not be a single problem, but rather a change in the user mix.
For example, clustering may reveal the following situations:
Situation 1: New Light Users Increase
These users may come from campaigns, SEO, social traffic, or push notifications. They are attracted into the product but only browse one or two pages before leaving.
This means DAU has increased, but browsing depth is insufficient. The problem may not be insufficient traffic, but rather that the first-time experience, homepage guidance, or content recommendation fails to encourage new users to continue exploring.
Situation 2: Deal Hunters Increase
If the increase in DAU mainly comes from deal-driven users, they may only want to check offers, claim rewards, or complete redemptions. This type of user has business value, but may not bring high PV.
At this point, the issue is not that they have no value, but whether the product has designed a “next step after the offer,” such as related articles, nearby offers, save reminders, membership tasks, or personalized recommendations.
Situation 3: Intent Searchers Increase
If search-oriented users increase but PV does not rise, it may mean users leave quickly after searching. There are two possibilities: one is that the search results are effective and users complete their task quickly; the other is that the search results are not good enough and users leave because they cannot find what they need.
Therefore, the team should not only look at search count. They should also examine post-search click-through, zero-result rate, refinement rate, PV after search, and task completion.
Situation 4: Content Browsers Decline
If content-oriented users who previously generated high PV are declining, overall PV may remain flat even if new users make up for DAU.
This may reflect weaker content recommendations, a lack of next-step entry points on article pages, less relevant related articles, unclear topic pages, or a mismatch between content topics and user interests.
Situation 5: Churn-risk Users Increase
If old users become less active, PV will also be affected. These users may still return occasionally, but their session frequency, PV per session, or article views have already declined.
At this point, a reactivation strategy is needed, rather than relying only on general push notifications or campaigns.
7. Turning Clustering Findings into UX / Product Strategy
Once the problem is broken down, the solutions become more precise.
| Clustering Finding | Possible Problem and UX / Product Strategy |
|---|---|
| New Light Users increase, but PV per User is low | New users are not effectively guided; improve onboarding, homepage recommendations, and beginner content entry points. |
| Deal Hunters increase, but content PV does not improve | Offer behavior is not connected to content exploration; add related articles, nearby offers, save functions, and expiry reminders on offer pages. |
| Intent Searchers leave quickly after search | Lack of exploration path after search; improve Search UX, autocomplete, related search, and AI Search summary. |
| Content Browsers’ browsing depth declines | Content recommendation or article navigation is insufficient; strengthen related articles, topic pages, and personalized feeds. |
| Community Lurkers are many but interact little | Users browse but face high interaction friction; add low-friction interactions such as polls, emoji reactions, and saving. |
| Churn-risk Users increase | Old users have weaker motivation to return; design reactivation push, return rewards, and personalized recall content. |
Therefore, when the boss sees that DAU is slightly increasing but PV only remains stable, the team should not immediately assume that the homepage is ineffective or that the content is unattractive. A better approach is to first use Business Logic to establish initial segmentation hypotheses, and then use clustering to break down the user structure, identifying which user groups are driving DAU growth and whether previously high-browsing-depth users are declining.
In this way, the product strategy can shift from the broad statement “we need to increase PV” to more specific action directions:
If new users are increasing but browsing little, improve the first-time experience.
If deal-driven users are increasing, design the next browsing path after offers.
If search-oriented users are bouncing, improve search results and related recommendations.
If content-oriented users are declining, re-examine content recommendations and article page navigation.
If old users are churning, design a reactivation strategy.
This is the practical value of clustering for UX / Product Strategy: it helps the team move from surface-level KPI problems into the behavioral differences between user groups, so they can identify more precise, explainable, and actionable product improvement directions.
8. How Clustering Turns into UX / Product Strategy
The real value of clustering lies in turning segmentation results into concrete product actions.
For example, after organizing different user groups into understandable user segments, we can begin to think about the UX / Product Strategy corresponding to each group.
| User Segment | Behavioral Characteristics and UX / Product Strategy |
|---|---|
| Content Browsers | High article views and low offer interaction; strengthen content recommendations, related articles, and personalized feeds. |
| Deal Hunters | High offer clicks and high redemption intent; optimize offer categories, search, saving, and expiry reminders. |
| Intent Searchers | High search count and high filter usage; improve Search UX, autocomplete, and AI Search answers. |
| Community Lurkers | High browsing with low commenting or sharing; lower interaction friction and add lightweight reactions, polls, and anonymous participation. |
| Growth Potential Users | Recent increase in activity; build usage habits, personalized push, tasks, and rewards. |
| Churn-risk Users | Declining activity and fewer return visits; design reactivation campaigns and personalized recall messages. |
In this way, clustering is no longer just a data analysis output. It can directly influence UX, feature design, content strategy, CRM, and the product roadmap.
In real discussions, the most valuable part is usually not the model itself, but the way the team starts discussing the product differently:
Not asking, “Should we add one more banner to the homepage?”
But asking, “Which type of user is this banner solving a problem for?”
Not asking, “Should we send more push notifications?”
But asking, “Should different clusters receive different messages?”
Not asking, “Should we build AI Search?”
But asking, “Which type of user most needs a more accurate and faster task-completion search experience?”
9. Looking at Feature Prioritization from a Case Study Perspective
In product development, teams often face many requests at the same time:
- Should we optimize search?
- Should we build personalized recommendations?
- Should we strengthen the offer page?
- Should we improve community interaction?
- Should we build a membership task system?
- Should we create AI Search?
Without segmentation, these decisions can easily become driven by “who speaks the loudest,” “which campaign is the most urgent,” or “which stakeholder needs it most.”
But if we use clustering to understand the size, activity, conversion rate, and retention performance of different user groups, we can make feature prioritization more evidence-based.
For example:
| Segmentation Finding | Product Decision |
|---|---|
| Deal Hunters are large in number and have high redemption intent | Prioritize improving offer search, categorization, and redemption flow |
| Intent Searchers search frequently but have a high post-search bounce rate | Prioritize Search UX or AI Search optimization |
| Community Lurkers are large in number but have low interaction rates | Design low-friction interaction features such as polls and reactions |
| Churn-risk Users are increasing | Strengthen reactivation and retention strategy |
This way, Feature Prioritization is no longer just a feature list ranking. It becomes a decision based on user behavior and product goals.
10. Clustering and Personalization: Not Everyone Needs the Same Homepage
For personalization, clustering provides a very practical way of thinking:
Different users entering the same product may actually expect to see completely different content.
Content Browsers may want to quickly see relevant articles. Deal Hunters may want to find offers as quickly as possible. Intent Searchers may expect more accurate and faster search. Community Lurkers may need lower-pressure interaction entry points.
| User Segment | Personalization Direction |
|---|---|
| Content Browsers | Recommend similar articles, topic content, and author content |
| Deal Hunters | Recommend nearby offers, limited-time offers, and high-redemption offers |
| Intent Searchers | Provide search suggestions, popular queries, and AI summaries |
| Community Lurkers | Recommend popular discussions and low-friction interaction content |
| Growth Potential Users | Push tasks, save reminders, and membership growth prompts |
| Churn-risk Users | Push re-engagement content and personalized return messages |
Therefore, the focus of personalization is not simply “recommending more content,” but providing more relevant product experiences based on different user goals.
11. Clustering and Push Notification Strategy
Push Notification is a tool that can easily be overused. When all users receive the same type of notification, it may bring traffic in the short term, but in the long term, it may cause fatigue or even lead users to turn off notifications.
When combined with clustering, Push Strategy can become more precise.
| User Segment | Push Notification Direction |
|---|---|
| Content Browsers | Push related topic articles and new content collections |
| Deal Hunters | Push limited-time offers and saved-offer expiry reminders |
| Intent Searchers | Push new results related to previous searches |
| Community Lurkers | Push popular discussions, polls, or lightweight interaction content |
| Churn-risk Users | Push personalized recall content or rewards |
From this perspective, Push Notification is not just a broadcast message. It becomes an engagement strategy designed for different user states.
12. Clustering and A/B Testing: Do Not Only Look at Overall Results
A/B Testing often focuses only on overall conversion or CTR, but in real product analysis, the overall result can sometimes be misleading.
For example, a new homepage design may only slightly improve overall CTR, but significantly improve performance for Content Browsers. Another search layout may not have a large overall impact, but may greatly improve task completion for Intent Searchers.
Therefore, clustering can help A/B Testing move from “overall version comparison” to “effect comparison across different user segments.”
| Test Item | Segment Difference to Observe |
|---|---|
| New Homepage Layout | Whether it is more effective for Content Browsers |
| Offer Category Entry | Whether it improves conversion for Deal Hunters |
| AI Search Result | Whether it improves task completion for Intent Searchers |
| Community Interaction Button | Whether it increases participation from Community Lurkers |
| Reactivation Message | Whether it reduces churn among Churn-risk Users |
In this way, the result of A/B Testing is not only:
Is Version A better than Version B?
It can further help us understand:
Which design produces what kind of effect for which type of user?
This is also close to the statistical thinking process of “first defining the problem, then forming a hypothesis, and then using data to validate it.” In UX / Product Experiment, we can first define a hypothesis, then observe how different segments respond to a new design, and determine whether the design is truly effective for the target users.
13. Clustering and Data-driven Persona
Traditional personas often come from interviews, observations, and research hypotheses. These methods are still important because they explain users’ psychology, context, and motivations.
However, if personas lack data support, they can easily become overly subjective stories.
Clustering can provide a stronger behavioral foundation for personas.
For example:
Persona 1: Content Explorer
- Frequently reads articles
- Interested in information, lifestyle, and entertainment content
- May not interact heavily, but consumes content steadily
- Suitable for personalized content recommendations and topic following
Persona 2: Deal-driven User
- Frequently checks offers
- Sensitive to discounts, rewards, and redemption flows
- Has high conversion intent
- Suitable for optimizing search, saving, expiry reminders, and redemption experience
Persona 3: Task-oriented Searcher
- Frequently uses search
- Has clear intent
- Expects to find answers quickly
- Suitable for improving Search UX, filters, AI Search, and result ranking
These personas are not just “imaginary people.” They are supported by real behavioral data and then enriched by UX Research with motivations and scenarios.
14. The Role of the UX Team in Clustering
Clustering is not only the work of the Data Team. UX / Product Teams should also participate.
The data model can identify groups, but the UX / Product Team is responsible for understanding and translating those results.
| Stage | Role of the UX / Product Team |
|---|---|
| Define the problem | Decide whether to solve retention, conversion, search success, or engagement |
| Select data | Judge which behavioral data truly represents user intent |
| Interpret clusters | Turn clusters into understandable user segments |
| Design strategy | Design corresponding UX / Product Actions for different segments |
| Validate impact | Use A/B Testing, KPIs, and user research to validate whether the strategy works |
Therefore, the UX Team does not need to become Machine Learning Engineers, but they need to know how to ask the right questions, understand model limitations, and turn data results into design judgment.
15. Limitations of Clustering: The Model Is Not the Answer; Interpretation Is the Key
Although clustering is valuable for UX / Product Strategy, it also has limitations.
1. Clustering Does Not Automatically Tell You “Why”
Clustering can tell you which users have similar behaviors, but it does not necessarily explain the reasons behind those behaviors. UX Research still needs to supplement the understanding through interviews, surveys, usability testing, and other methods.
2. Segmentation Results Need to Be Updated Regularly
User behavior changes over time due to product features, seasons, campaigns, and market conditions. Therefore, clustering should not be done only once. It should be reviewed regularly.
3. Segmentation Does Not Mean Fixed User Labels
User segments help the team understand behavioral patterns. They should not become fixed labels. Users may move from one segment to another.
4. Data Quality Affects the Results
If event tracking is inaccurate, data is incomplete, or definitions are inconsistent, segmentation results can become distorted. Therefore, before doing clustering, the team needs to check event taxonomy and data quality.
16. Conclusion: Clustering Is the Bridge Between Data and Design
To me, the most valuable part of clustering is not the model itself, but how it helps UX / Product Teams re-understand users.
Especially when a product shows a situation where DAU is slightly increasing but PV only remains stable, clustering helps the team see user structure changes behind surface-level KPIs.
It helps the team stop looking only at one average number and start seeing behavioral differences across user groups.
It can help us answer:
- Which type of user is driving DAU growth?
- Which users are not bringing enough browsing depth?
- Which high-PV users are declining?
- Which features are most valuable to different segments?
- Which users are starting to churn?
- Which designs can improve conversion?
- Which strategies can improve retention?
Ultimately, good UX / Product Strategy should not only be designed for the “average user.” It should understand the real behaviors of different users and design more precise and valuable product experiences for them.
Clustering is not the endpoint. It is a starting point.
What truly matters is whether the team can turn segmentation results into a product strategy that is understandable, nameable, and actionable.