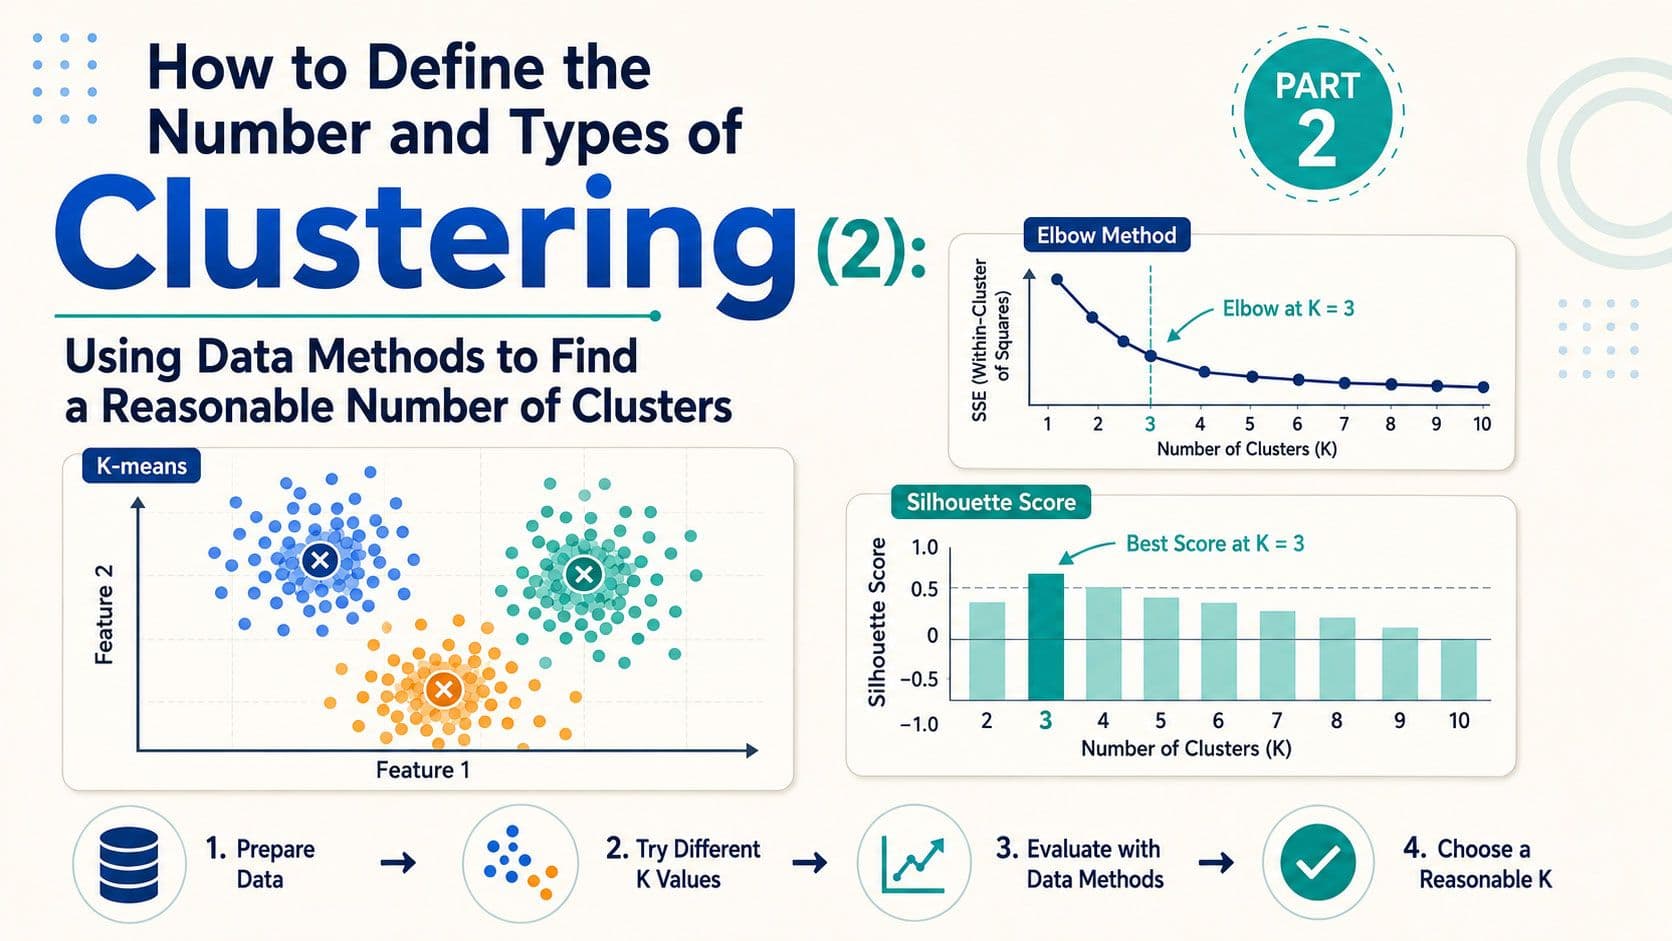
When defining the number of clusters, we should not rely only on intuition. A more reliable approach is to combine business objectives with data-driven methods. For example, we first clarify the purpose of the analysis, then use methods such as the Elbow Method and Silhouette Score to identify a more reasonable K value.
For K-means, K represents the number of clusters we want to divide the data into. The algorithm then assigns each data point to the nearest centroid based on distance.
About the purpose of the analysis, more detail please see How to Define the Number and Types of Clustering (1) - Building Segmentation Hypotheses with Business Logic
Method 1: Elbow Method
Elbow Method is a method used to help us decide how many clusters K-means should divide the data into, which is the K value.
Because K-means requires us to specify K in advance, and one of the limitations of K-means is that it is not easy to identify the correct K value, the Elbow Method is commonly used as a supporting method. The Elbow Method mainly observes whether the within-cluster error decreases significantly under different K values. When K increases, the data points within each cluster usually become more concentrated, and the error typically decreases. However, when the rate of decrease begins to slow down, that turning point looks like an elbow, so it is called the elbow point.
For example, after understanding the business context, we may identify around 4–5 candidate user groups. Therefore, we can test from K = 2 to K = 6.
What does the Elbow Method look at?
| K Value | Clustering Interpretation |
|---|---|
| K = 2 | Too broad; can only roughly separate high-activity and low-activity users |
| K = 3 | Starts to reveal major behavioral differences |
| K = 4 | Clusters become clearer |
| K = 5 | Can correspond to a more complete set of business user types |
| K = 6 | May start to over-segment, increasing the cost of business interpretation |
If the error does not decrease much after K=5, then K=5 can be considered as one candidate number of clusters.
How should we interpret the Elbow Method score?
The core idea of the Elbow Method is:
When K increases, the clustering error decreases. However, after a certain point, adding more clusters brings only very small improvement. This turning point looks like an elbow, so it is called the Elbow.
Simply put, it helps us find:
The point where adding more clusters no longer brings much benefit.
For example:
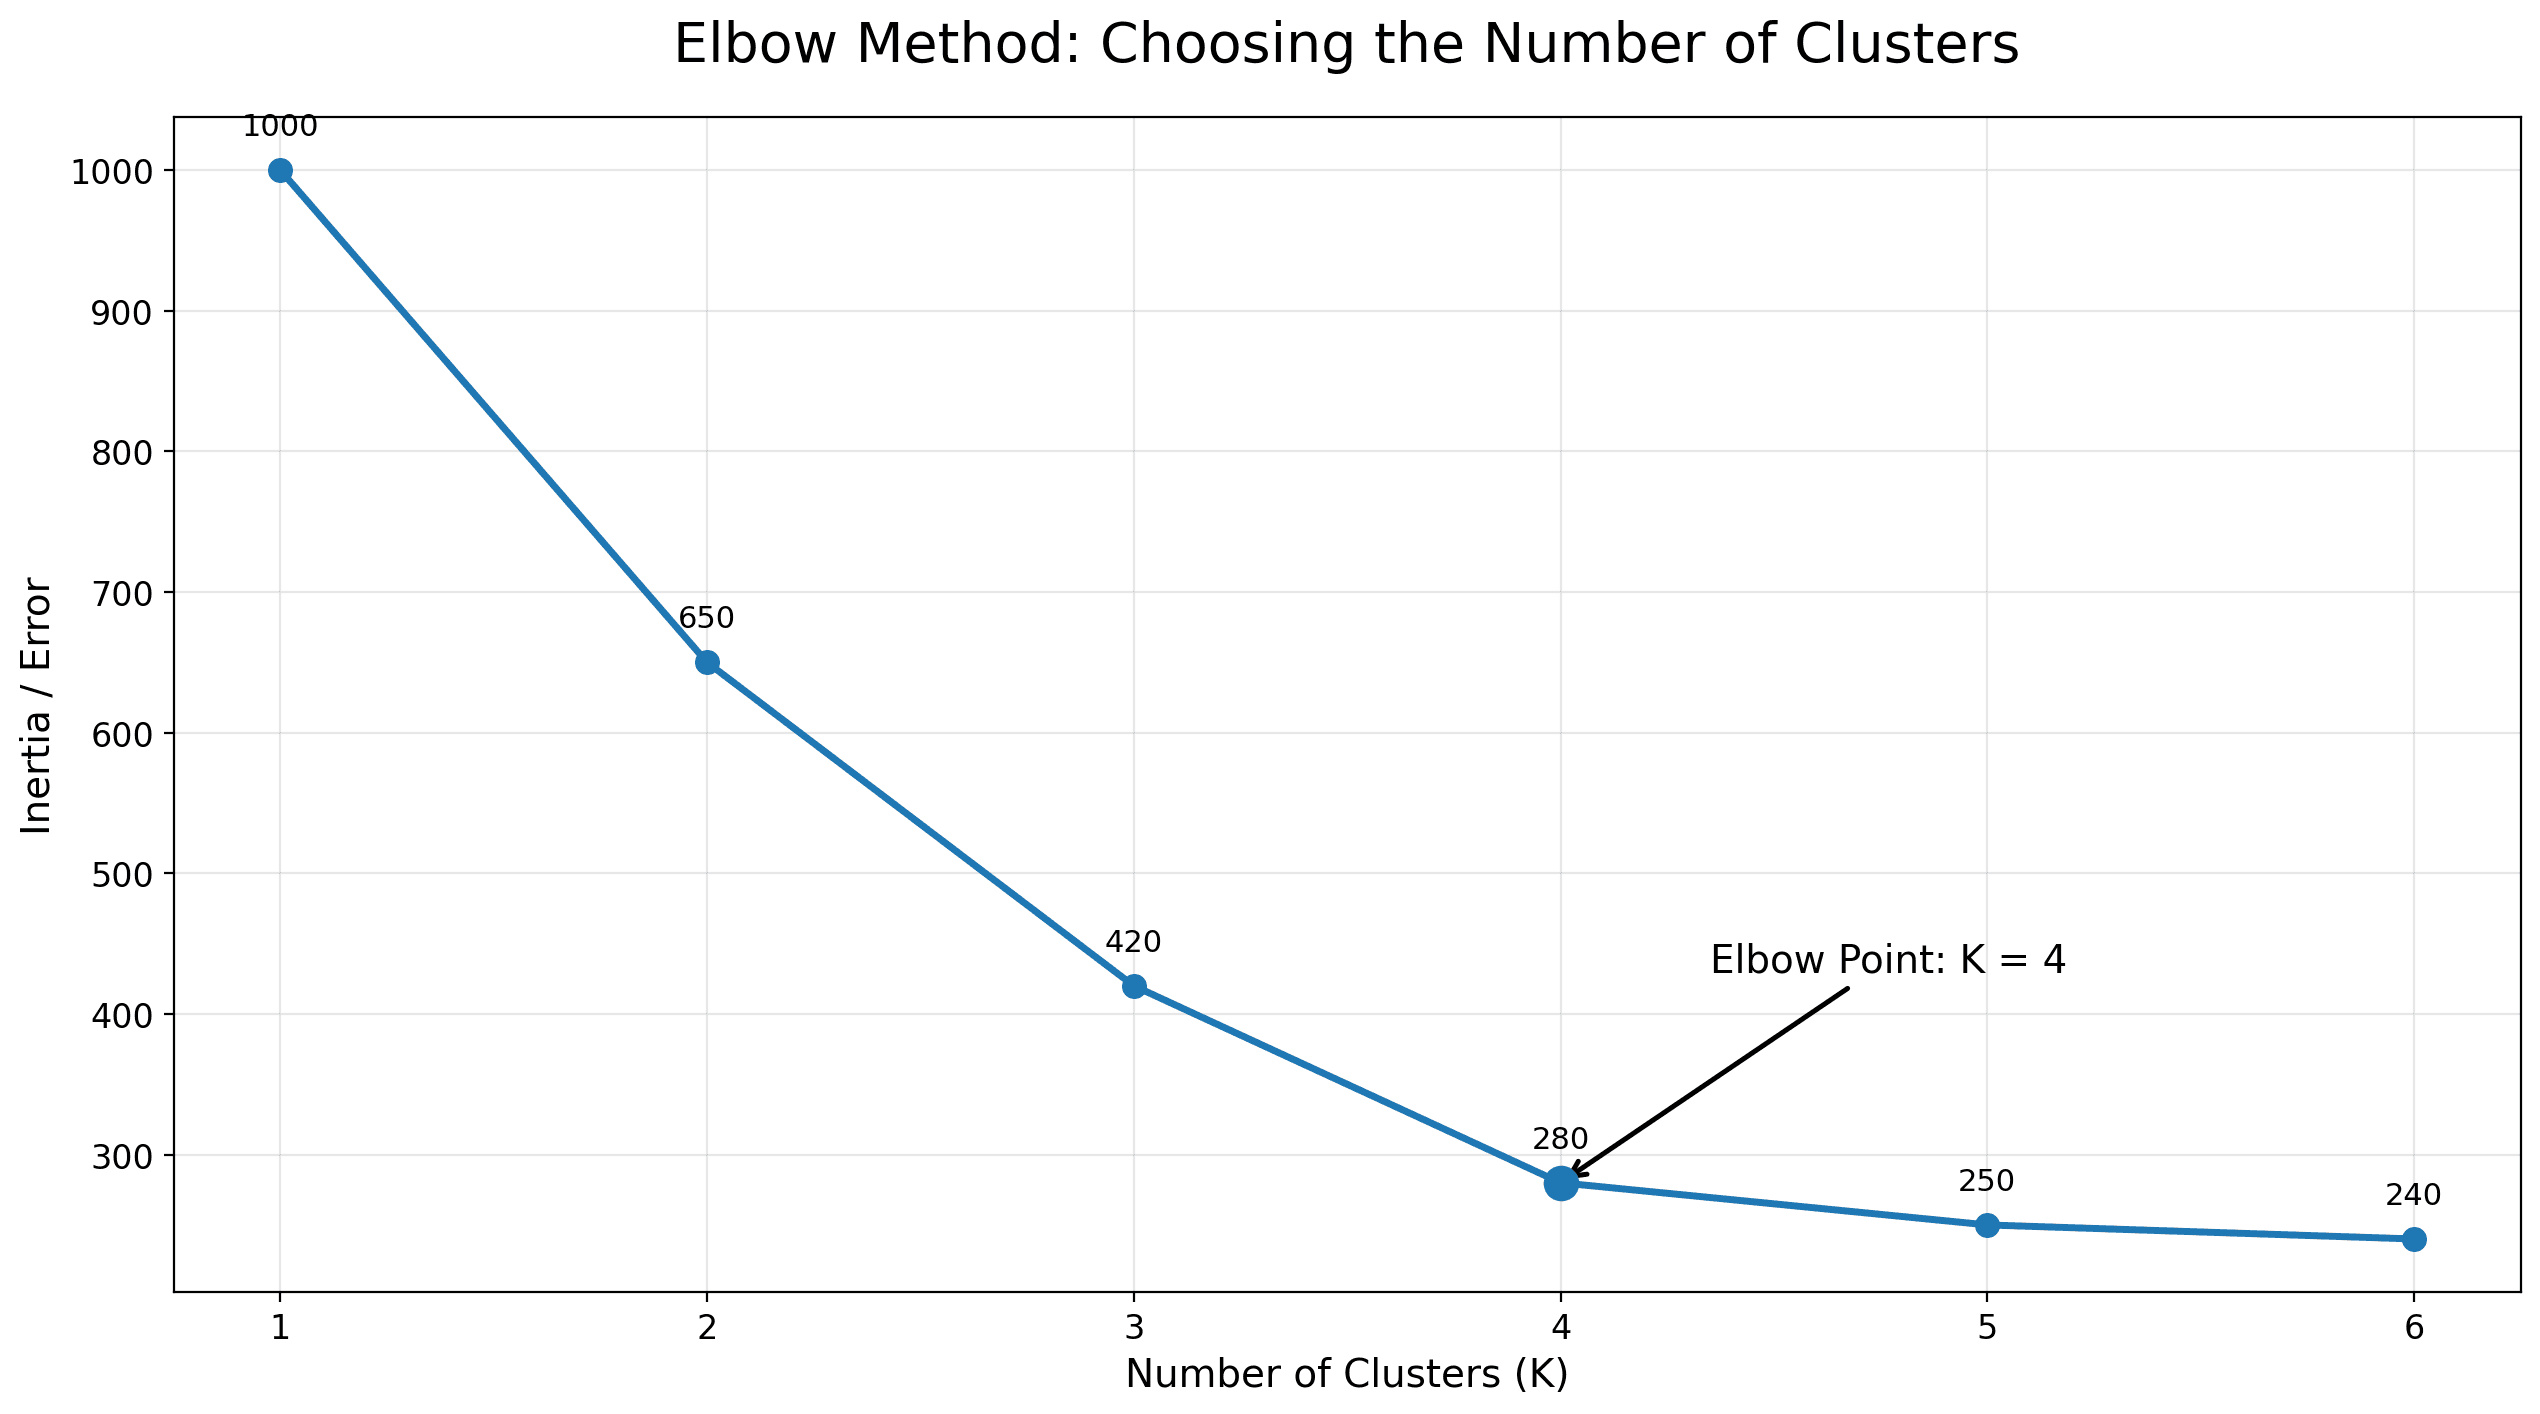
| K | Inertia / Error |
|---|---|
| 1 | 1000 |
| 2 | 650 |
| 3 | 420 |
| 4 | 280 |
| 5 | 250 |
| 6 | 240 |
You can see that the error drops significantly from K=1 to K=4, but after K=5 and K=6, the improvement becomes much smaller.
This means:
K=4 may be a reasonable candidate, because adding more clusters does not bring much additional benefit.
Method 2: Silhouette Score
Silhouette Score is another method used to determine how many clusters K-means should select.
If the Elbow Method looks at whether the error still decreases significantly when K increases, then the Silhouette Score looks at:
Whether the resulting clusters are clear and well separated.
Silhouette Score checks:
- Whether users within the same cluster are similar
- Whether different clusters are sufficiently separated
What does Silhouette Score look at?
| Check Item | Meaning |
|---|---|
| Whether users within the same cluster are similar | Whether users inside the cluster have similar behavior |
| Whether different clusters are separated | Whether different clusters have clear differences |
Simply put:
Good clustering should mean that users within the same cluster are very similar, while users in different clusters are very different.
How should we interpret Silhouette Score?
Silhouette Score usually ranges from -1 to 1.
| Score | Interpretation |
|---|---|
| Close to 1 | Good clustering; users within a cluster are similar, and clusters are well separated |
| Close to 0 | Cluster boundaries are unclear; some users may be difficult to assign to a clear group |
| Less than 0 | Possible incorrect clustering; users may be closer to another cluster |
For example:
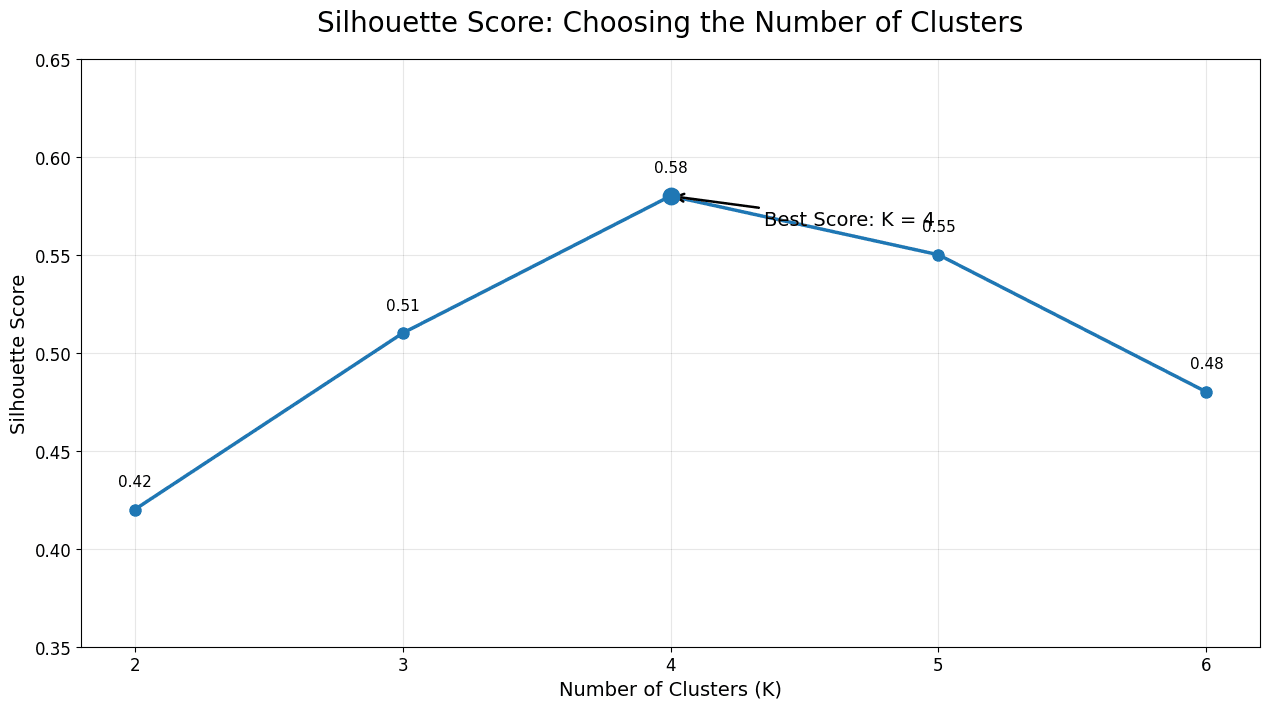
| K | Silhouette Score |
|---|---|
| 2 | 0.42 |
| 3 | 0.51 |
| 4 | 0.58 |
| 5 | 0.55 |
| 6 | 0.48 |